
How InsuranceMarket Creates Advanced Email Performance Reports with Moosend’s API & Google Data Studio
Leveraging powerful reporting and analytics is key to monitoring your digital marketing efforts. This post will show you how to use Moosend’s API to automatically create and update informative dashboards that deliver data-driven insights.

About InsuranceMarket
InsuranceMarket is a leading provider of insurance comparison and brokerage services, offering a comprehensive platform for comparing insurance products and securing policies from various providers. They specialize in delivering tailored insurance solutions to meet diverse customer needs, backed by a user-friendly interface and robust data analytics. Their services help consumers make informed decisions by providing transparent comparisons and access to a wide range of insurance options.
- Industry: Insurance Comparison and Brokerage
- Company Size:60 employees
- Location: United States
Introduction
Using powerful reporting and analytics is a key method for tracking digital marketing efforts. Collecting insightful data not only helps predict future actions and plan accordingly but also allows for monitoring email performance and making informed business decisions. While tracking engagement is essential, enhancing reporting can be achieved with just a few simple steps.
How To Create Custom Reporting Trends

As mentioned, generating email reports enables tracking key email marketing metrics, such as:
- Open rates
- Click-through rates (CTR)
- Conversions
- Unsubscribes
Currently, Moosend’s Custom Reports do not include a widget to display metric trends over time (e.g., weekly, monthly, yearly). However, there is a straightforward workaround until this feature becomes available.
Moosend’s comprehensive API allows users to extract the necessary data and create custom reports or dashboards. To illustrate this, the solution used by InsuranceMarket will be demonstrated, offering a replicable approach.
Ready to build a personalized dashboard for streamlined data organization and sharing?
Step 1: Find Your Moosend API Key & Create A Google Apps Script
The first step is to open a new Google Sheet and navigate to “Extensions.” Next, select the “Apps Script” option, as shown in the image below: 
A new window will open, directing you to the Apps Script platform. Here, copy and paste the following code as shown below:
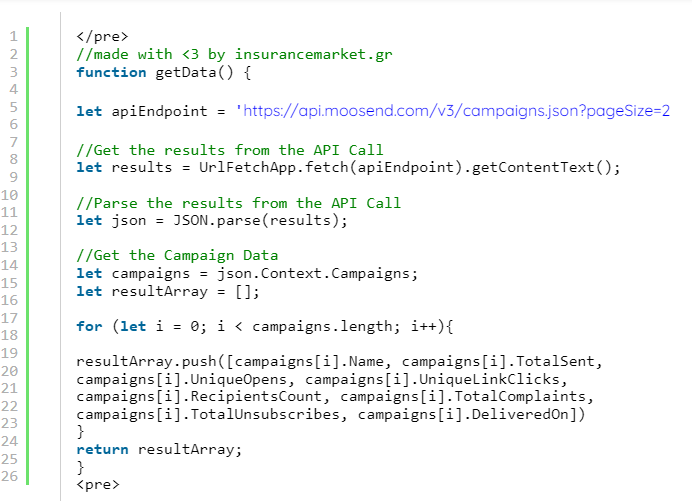
Before proceeding, ensure you replace YOUR-API-KEY (found under let apiEndpoint =) with your own API key. This step is crucial for proper functionality, so double-check your key before moving forward.
If you’re having difficulty locating your Moosend API key, refer to the image below for guidance.
Log in to your Moosend account, click on “Settings” in the top right corner, and find your API key under the “API Key” tab on the left menu. Click on it, copy the key, and replace it in the code.

After that, you need to save the script.

Now you are ready to move onto your next step.
Step 2: Call Your Script Through Google Sheets
After saving your script, return to the Google Sheet you created. Then, call your script using the function na
me you assigned to it, which in this case is getData().

To fetch your data, you have to add the name of the function in a cell.

The sheet will then be populated with your campaign data. As shown below, it will display the total sends, opens, clicks, recipients, complaints, and unsubscribes.

Now let’s move on to the third and final step.
Step 3: Visualize Your Data With Data Studio
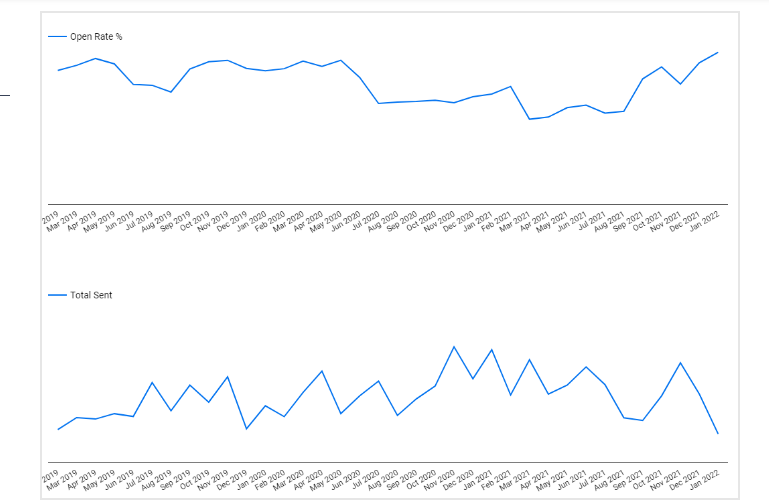
With the data now available, you can create your own visualizations. For instance, in this example, we examined the monthly trends for Open Rate% and Total Emails Sent over the past two years. This visualization helps identify dips and peaks in your campaigns, allowing you to optimize your strategies accordingly.
To visualize the data, use Data Studio to create a new report. Then, click on “Resource” and select “Manage added data sources.”
Here, add the Google Sheet you created earlier to begin the visualization process. Select the spreadsheet and the specific worksheet where you extracted the data, and then check the two checkboxes:

And that’s all you need to create data visualizations using Moosend’s API and Google Suite!
Data Studio is an ideal tool for crafting the reports you need to simplify your reporting process.
Custom Report Dashboard DIY
Finding solutions to common problems is crucial for optimizing email marketing efforts. With straightforward tools and Moosend’s API, you can easily create data visualizations to enhance your reporting.
If you’re already using Moosend, give this process a try and share your results with us! If not, consider joining us to discover what you can achieve with Moosend.

Send, Convert, Repeat: Moosend does it all
Go from unread to subscribed. And from manual to automated with the #1 intuitive email marketing and marketing automation platform. Moosend is the simplest and most modern solution to deliver email marketing and automation experiences that drive real revenue growth. Deliver beautiful emails that get opened and clicked every time. Personalized content to every subscriber. Fully customizable templates. Build relationships that lead to conversions.
